
KaneAI - Testing Assistant
World’s first AI-Native E2E testing agent.

How To Debug Websites Using Safari Developer Tools
Veethee Dixit
Posted On: March 23, 2022
Safari is the default browser on iPads, Macbooks, and iPhones. It lies second on browser preferences right after Chrome. Its 250+ features offer users striking benefits that set it apart from other most popular browsers like Chrome and Firefox. Building on that, iPhone’s popularity has resulted in a global smartphone market share of 53.6% for Safari.

Last year, Apple’s number of active devices witnessed a significant increase to 1.5 billion. Since the user base keeps rising, Apple constantly ensures a near-perfect user experience and an optimized performance across all its devices.
Thanks to its good usability and the massive popularity of Apple devices, Safari has gained a broad user base. If that’s the case, it’s vital to offer them an ideal browsing experience across various browser versions. But once you go ahead and launch a website, debugging it after encountering a bug becomes almost impossible.
That’s why it’s crucial to debug websites for Safari before they go out there. In this article, we look at how to debug websites using Safari Developer tools.
But before that, let’s check out why it’s vital to debug websites on Safari.
Let’s dive in.
TABLE OF CONTENTS
- Why debug websites on Safari?
- Different methods to debug websites using Safari Developer tools
- Debugging websites with Responsive design mode
- Debugging websites on Safari using Web Inspector
- Debugging websites using Safari Developer tools on LambdaTest
- Remote debugging for iOS Safari on OS X
- Frequently Asked Questions (FAQs)
Why debug websites on Safari?
Safari has been a part of the most popular browsers since 2003. Its first version was released the same year with Mac OS X Panther. Since the iPhone launched in 2007, a mobile version of Safari has been included in all iOS devices. If a user doesn’t change it, it’s the default browser on Apple devices.
Considering the number of Apple devices and their never-ending versions, the combinations of different features and screen resolutions are enormous. But when you debug websites on Safari before launch, your users can hop on to the Window that quickly takes them to your services and products.
Web developers must validate website appearance across different screen sizes to maintain cross browser compatibility. This ensures the correct rendering of web pages across various browsers. It also provides a comparatively superior user experience with consistency. It’s also essential to consider how a particular version of Safari might interact with a device’s hardware specifications. This adds to another form of verification that is crucial for the web development pipeline.
Since Safari is the second most popular browser, businesses shouldn’t risk losing out on potential customers because of website bugs. After all, vulnerability, compromised navigation, and other incompetencies can turn a simple user interface into a screaming nightmare!
On the upside, device functionality and operating system are more superficial than Android devices. According to QA, deciding on a testbed is straightforward too.
Also, read – How To Inspect Elements On Android Devices
Different methods to debug websites using Safari Developer tools
Before debugging websites using Safari Developer tools, it’s essential to have a device that runs on iOS or macOS. This section will explore three different techniques to debug websites using Safari Developer tools.
- Debug Using Responsive Design Mode in Safari Developer tools.
- Debug Websites on Safari using Web inspector on iPhones and iPads.
- Debug Websites using Safari Developer tools on the LambdaTest platform.
- Remote debugging for iOS Safari on OS X
Let’s take a look at different methods one by one!
Debugging websites with Responsive design mode
In this section of the article on Developer tools for Safari, we will look at how you can debug the mobile view of a website using Safari Developer tools. Remember that you need to enable the Developer menu before accessing the responsive design mode since it’s disabled by default for Safari.
- After launching the Safari browser, select Preferences > Advanced.
- Check the box and click the Show Develop menu in menu bar.
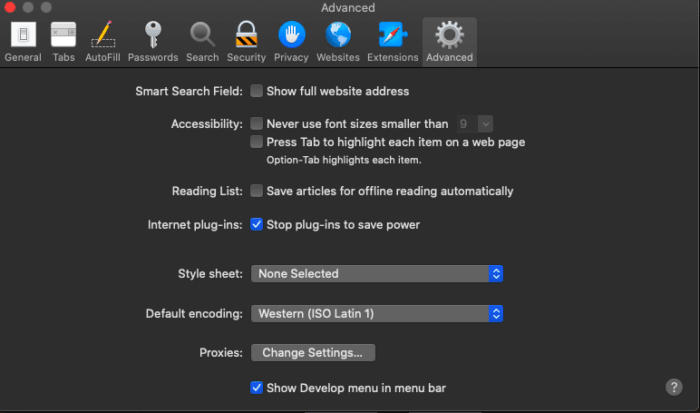
Here is how it looks.

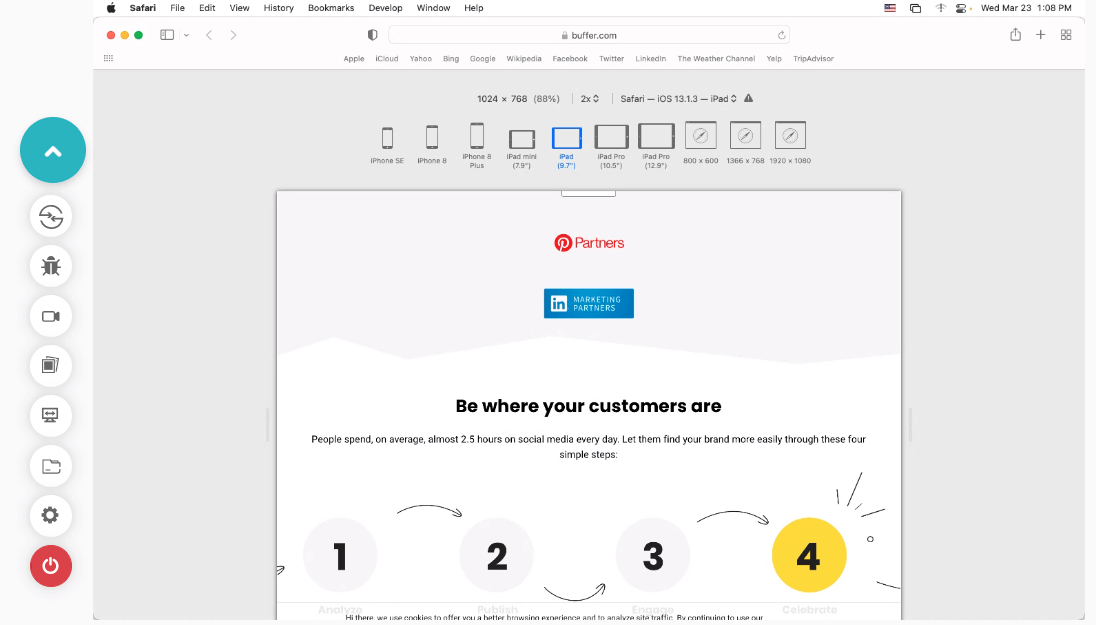
Below are the steps for viewing a website’s mobile version with the help of Safari Developers tools –
- Launch Safari and visit the URL of your choice.
- Go to Develop > Enter Responsive Design Mode from the menu bar.
- After that, you can view the desired website by selecting the Apple mobile device.
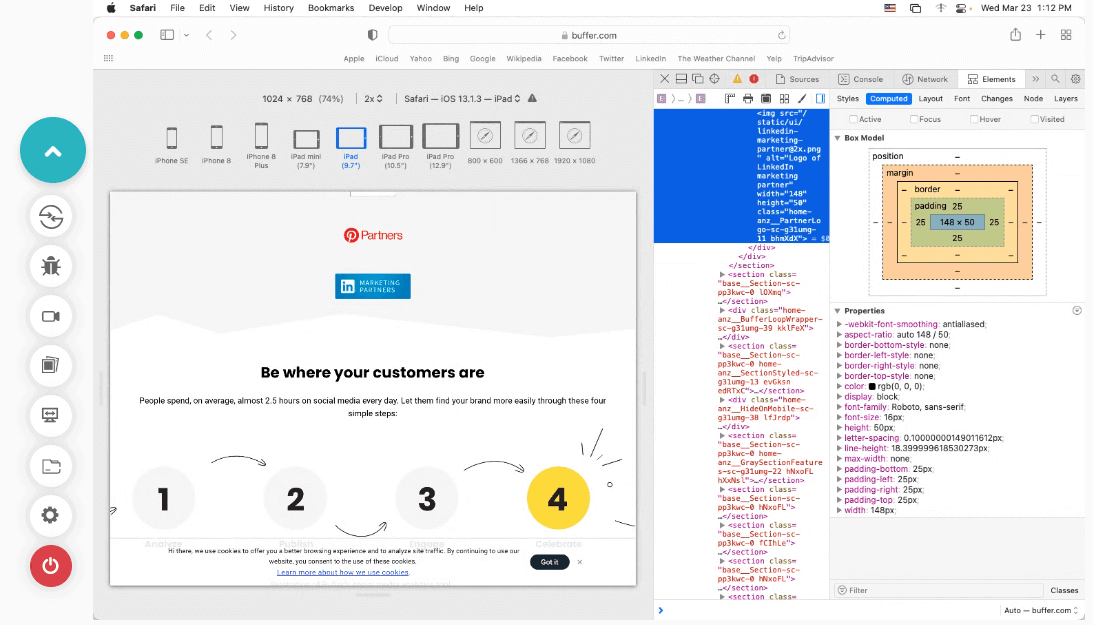
- If you wish to debug a particular issue for a specific viewport or screen size or inspect a particular element, Web Inspector is the key to doing it. Developers can find it in the development view and use the element selector to inspect specific elements after activating the inspector.
Debugging websites on Safari using Web Inspector
As mentioned in the above method, here is how you can easily debug websites on iPhone and iPads on Safari using the Web Inspector.
Let’s take a look.
- Connect your iPad or iPhone to the machine.
- Navigate to Settings > Safari > Advanced and enable the Web Inspector toggle button.
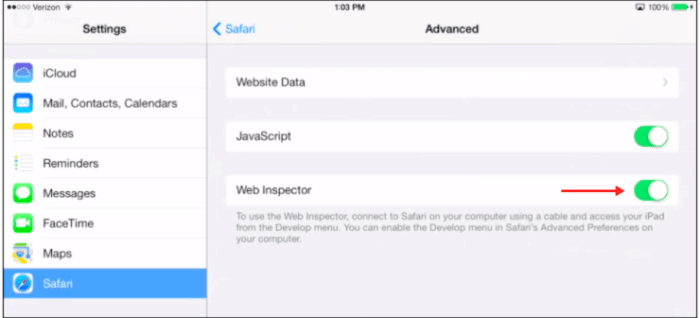
You can now preview the desired web page on your Safari browser in mobile or start debugging using Safari Developer tools.
Read More – How To Inspect Elements on iPhone
You can also refer to the below tutorial on how to perform responsive testing using chrome dev tools protocol In Selenium 4.
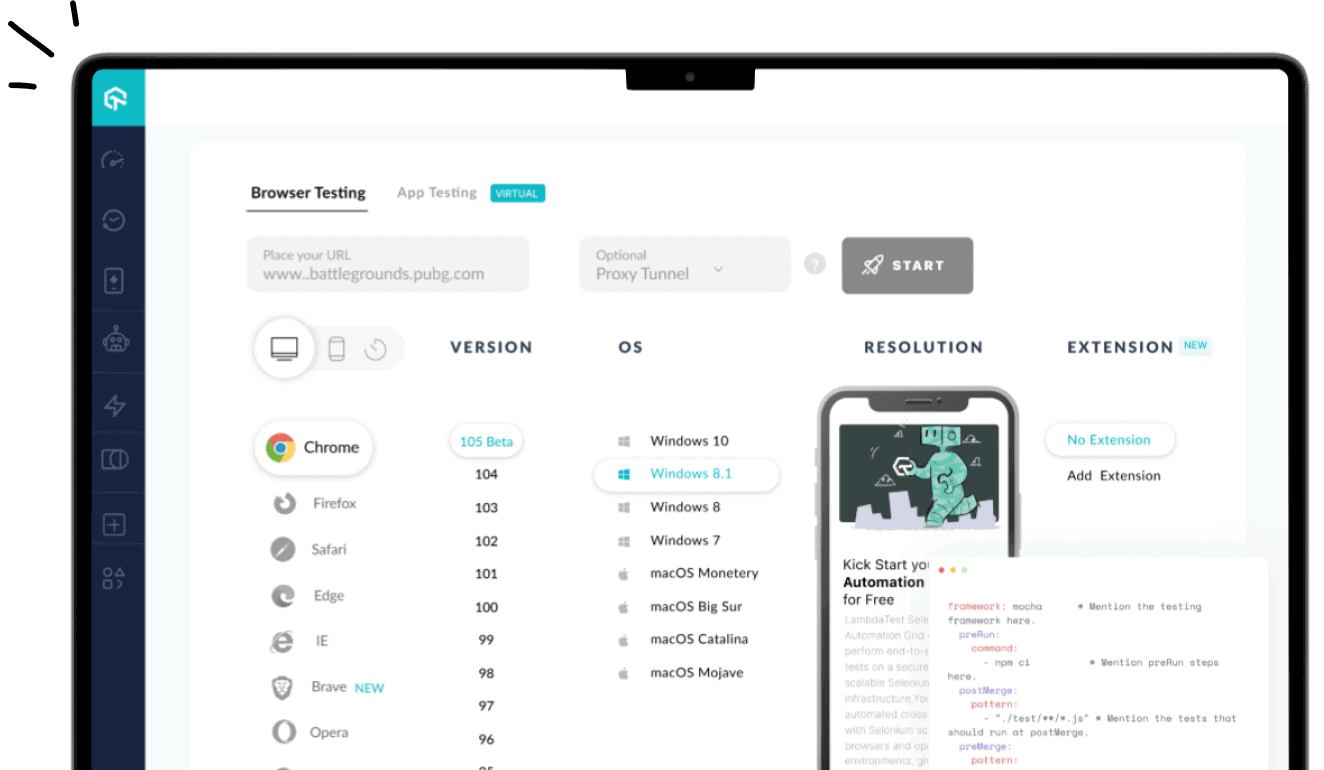
Debugging websites using Safari Developer tools on LambdaTest
Cross browser testing platforms like LambdaTest provides integrated Safari Developer tools that allow users to debug websites in real-time on iOS simulators for browser testing. It also enables devs and testers to test on Safari browser online across different real Safari browser versions and operating systems. They can easily view and debug any JavaScript, CSS, or HTML web applications or websites and check their sites through changes in code via developer tools across different iOS devices.

Why Use LambdaTest for Safari Browser Debugging?
LambdaTest is a cross browser testing platform that offers an online browser farm of 3000+ real browsers and operating systems to perform browser and app testing of websites and web applications. Therefore, you can perform web testing on different versions online for identifying browser compatibility issues. In addition, it facilitates browser testing on real Safari browsers online that run on real machines. This ensures website compatibility on all legacy Safari versions and new ones from Safari 15 to 5.1.
Users get a broad range of Safari browser versions for debugging, ensuring a pixel-perfect experience for customers. In addition, thanks to parallel testing, LambdaTest helps you reduce test execution time for testing your website on both mobile and virtual macOS online.
The best thing about the LambdaTest platform is that you don’t even have to install or download anything, not even virtual machines! The cloud grid of mobile Safari browsers allows users to run Selenium IDE tests on cloud.
Also, read – How To Run Test On macOS Using Selenium Safari Driver
Also, with LambdaTest integrations, you can directly mark your bugs from LambdaTest and use Asana, JIRA, or other bug management tools. In addition to that, users can also move them to Gitlab, GitHub or carry out communication over Slack. Other integrations include Mantis Bug tracker, Clubhouse, Bugherd, TeamWork, Paymo, VSTS, and BitBucket.
LambdaTest tunnel allows users to access online Safari browsers for local page testing of private or locally hosted web apps for browser compatibility on different Safari browsers. Single-click responsive testing and full-page screenshot testing are some added functionalities.
With this Screenshot Testing Tutorial, you will learn how to perform Automated Screenshot Testing on the LambdaTest platform.
Below are the steps on using iOS Developer tools for Safari on the LambdaTest platform for real-time testing –
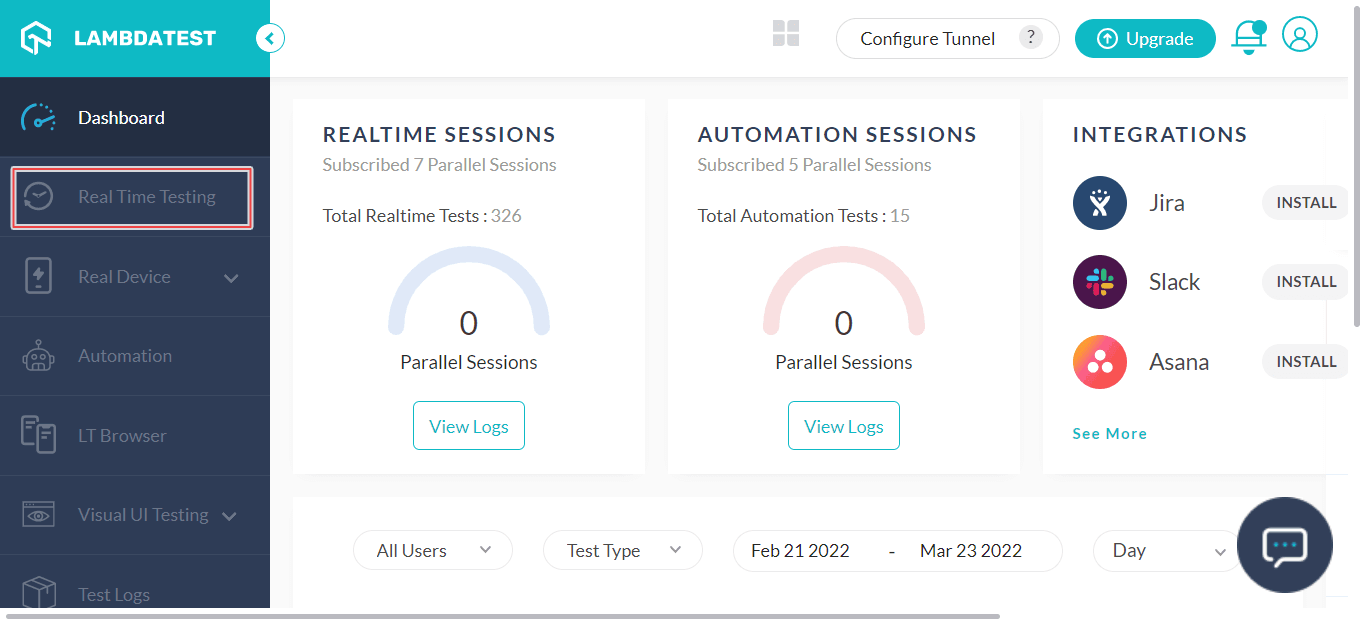
- Login to your LambdaTest account. If you don’t have an account, register on LambdaTest .
- If you want to test on emulators and simulators, select Real Time Testing from the left sidebar. To test on a real device cloud, choose Real Time from the Real Device dropdown.
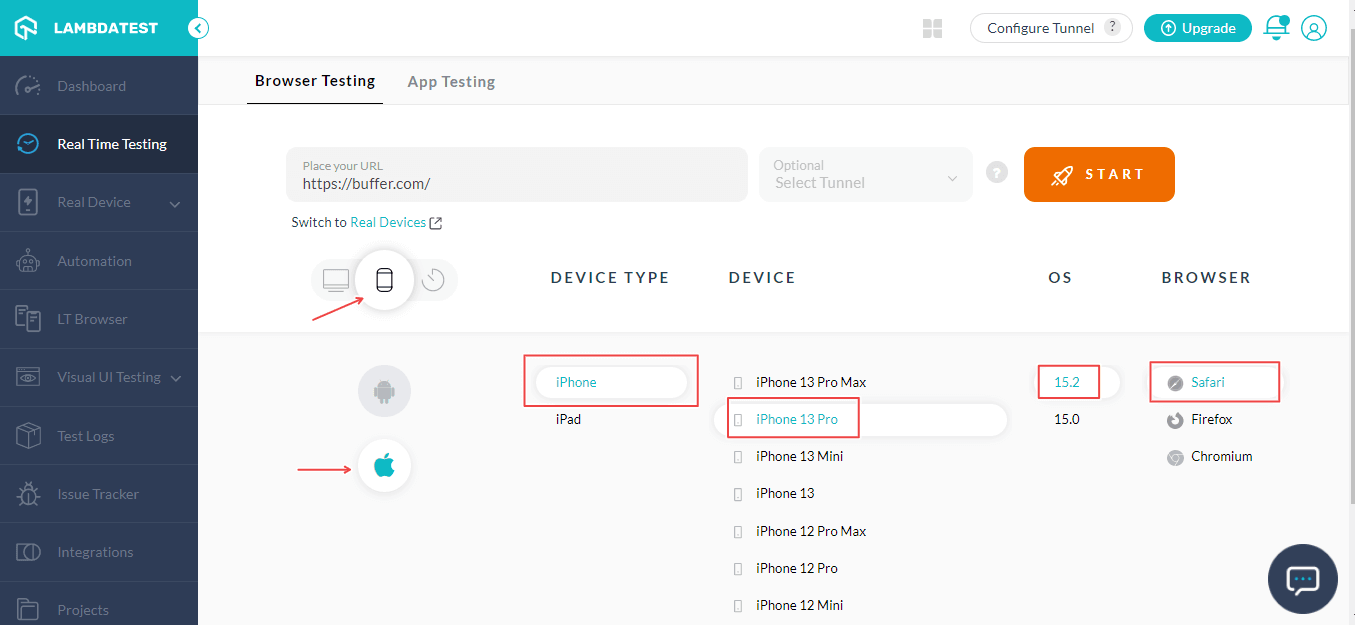
- Enter a test URL, select the Mobile OS icon, choose DEVICE TYPE, DEVICE, OS, and BROWSER. Then, click START.
- It will route you to the selected cloud-based iOS simulator. To open the integrated Safari Developer tools, click the DevTools icon.
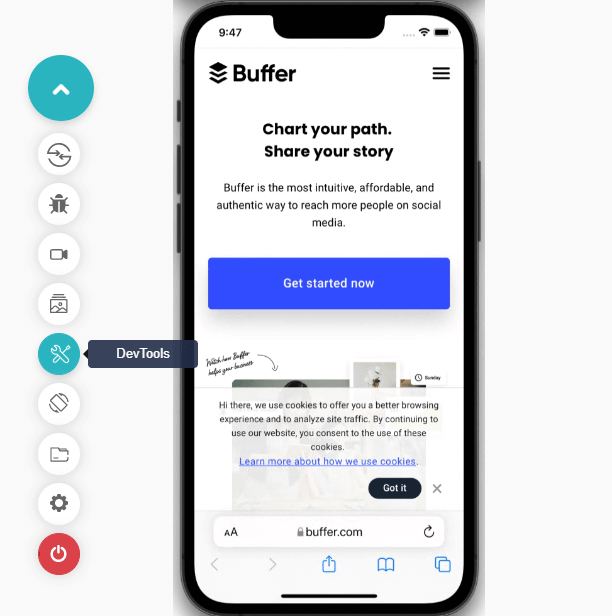
You can now debug your web applications or websites using Developer tools for Safari.
If you want to debug websites on real devices, here is a quick tutorial on performing real-time testing on real devices.
For more video tutorials around Mobile app testing, Cypress test automation, Selenium testing, subscribe to the LambdaTest YouTube Channel.

Remote debugging for iOS Safari on OS X
Remote debugging iOS Safari on OS X can be a challenging task. But it’s simpler than you might think. First, install the Safari browser version on your computer.
- Connect an iPhone or iPad to a Mac computer with the help of a USB.
- Enable Web Inspector on your device by selecting Settings > Safari > Advanced and switching on the Web Inspector toggle. This will switch it on in case that wasn’t in the default mode.
- After successfully enabling Web Inspector, do the same with the develop menu by selecting Safari > Preferences > Advanced and check the box in the menu bar. Don’t do anything if it’s enabled already by default.
- Ensure that your devices are plugged in on your computer before opening your desired web page. Select Develop > iOS device name and select the page you wish to debug.
- Now, you can view and update the DOM (Document Object Model) and have access to the JavaScript console and some other features and options.
Try LT Debug Chrome Extension for debugging websites!
100+ Free Online Tools From LambdaTest!
LambdaTest has come up with an index of 100+ free online tools for developers and testers. From HTML, XML, and JSON formatters to robust data generators, and hash calculators. LambdaTest’s free online tools are built to help engineering teams accelerate and be more productive with their daily activities.
Code Tidy
- JSON Prettify
- JSON Minify
- HTML Prettify
- HTML Minify
- JavaScript Minify
- CSS Minify
- CSS Prettify
- XML Minify
- XML Prettify
Data Format
- IDN Encode
- IDN Decode
- XML to JSON Converter
- JSON to XML Converter
- BCD to Decimal
- HEX to Decimal
- Decimal to BCD
- UTF8 Decode
- UTF8 Encode
- HEX to RGB Converter
- RGB to HEX Converter
- HTML to Markdown Converter
- Markdown to HTML Converter
- Decimal to Gray Code Converter
- Gray Code to Decimal
- URL Decode
- URL Encode
- Base64 Encode
- Base64 Decode
- Text to HTML Entities Converter
- HTML Entities to Text Converter
Random Data
- Random JSON Generator
- Random XML Generator
- Random CSV Generator
- Random YAML Generator
- Placeholder Image Generator
- Random Binary Generator
- Random Character Generator
- Random Color Generator
- Random Date Generator
- Random Decimal Fraction Generator
- Random Decimal Generator
- Random GUID Generator
- Random HEX Generator
- Random Octal Generator
- Random IP Generator
- Random MAC Generator
- Random Number Generator
- Random Paragraph Generator
- Random Password Generator
- Random Time Generator
- Random UUID Generator
- Random Sentence Generator
- Random String Generator
- Random Word Generator
- Random Data from RegEXP
- Test Data Generator
- Lorem Ipsum Generator
- Credit Card Number Generator
- QR Code Generator
- Random Byte Generator
Security Tools
- Hash Calculator
- Hash MAC Generator
- CRC32 Hash Calculator
- CRC32B Hash Calculator
- Ripe MD 128 Hash Calculator
- Ripe MD 160 Hash Calculator
- Ripe MD 256 Hash Calculator
- Ripe MD 320 Hash Calculator
- MD2 Hash Calculator
- MD4 Hash Calculator
- Adler32 Hash Calculator
- Gost Hash Calculator
- Whirlpool Hash Calculator
- MD5 Hash Calculator
- SHA1 Hash Calculator
- SHA256 Hash Calculator
- SHA384 Hash Calculator
- SHA512 Hash Calculator
Utils
- Find and Replace String
- HTML Escape
- HTML Unescape
- Difference Checker
- Shuffle Letters
- Shuffle Text Lines
- Sorting List
- Split Your String
- Text Lowercase
- Text Uppercase
- Text Repeater
- Text Rotator
- Character Count
- Word Count
- Lines Count
- Sentence Count
- URL Parse
- JSON Escape
- JSON Unescape
- Extract Text from HTML
- Extract Text from JSON
- Extract Text from XML
- Strip HTML
- JSON Validator
Achieve the highest browser coverage, accurate testing, and easy debugging with the Real Time Testing feature on LambdaTest!
Summing Up!
You won’t automatically gain a billion users by designing a feature-filled website. Even if you manage to acquire people to browse your website with compromised features, they will encounter bugs and leave your platform forever. Remember that retention is vital to ensure consistent conversions and high ROI besides gaining users. Every bug in your interface takes your customers closer to your competitors.
Read – How Do You Calculate Your ROI On Test Automation With Selenium?
The methods mentioned above are helpful for QA teams to debug websites using Safari Developer tools. Interface bugs can lie on the spectrum of simply being annoying and causing major user experience disruptions. Debugging on Safari browsers is necessary to launch web applications that work well under all conditions.
Some developers and testers might find website debugging for Safari a bit challenging. But it’s important to remember how crucial it is to offer a satisfying and seamless user experience for better customer acquisition and retention.
Do you have any questions regarding how to debug a website using Safari Developer tools? Let us know in the comments below.
Frequently Asked Questions (FAQs)
How do I use Developer tools in Safari?
To use Developer tools in Safari, you can use the Safari Develop menu to debug websites and web apps and ensure your website renders fine in all popular web browsers. In case you don’t find the Develop menu in the menu bar, navigate to Safari > Preferences, click Advanced, then select the checkbox ‘Show Develop menu in menu bar’.
Does Safari have a debugger?
Yes! Safari’s Web Inspector lets users customize, debug, and optimize websites for optimal speed and usability.
Author
Veethee Dixit
I’m a Computer Science Engineer by degree and a passionate writer by choice. The credit for my profession as a web content writer goes to the knack for writing combined with a technical background.
Blogs: 12