
KaneAI - Testing Assistant
World’s first AI-Native E2E testing agent.

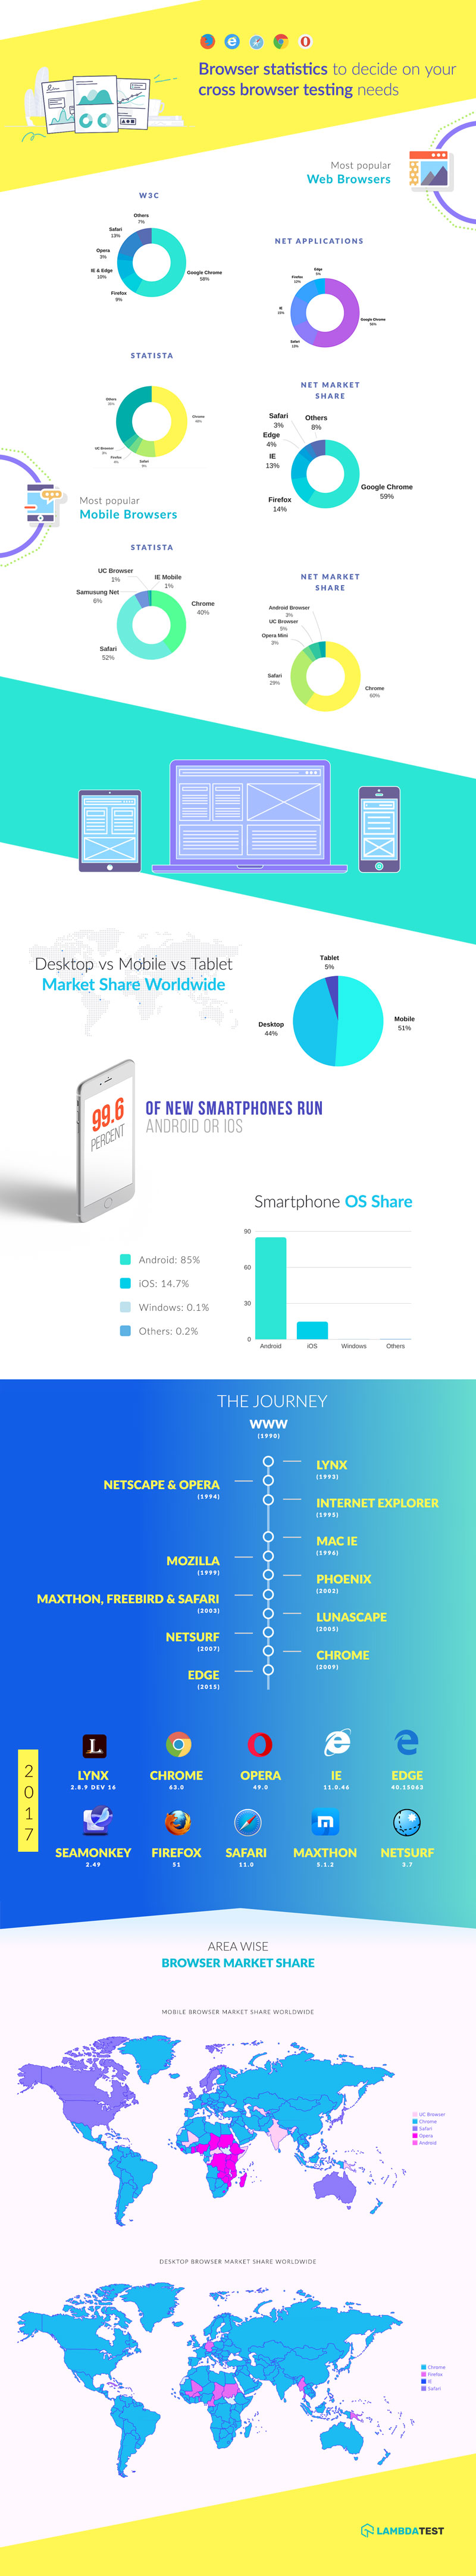
Browser Statistics To Decide On Your Cross Browser Testing Needs: Infographic
Deeksha Agarwal
Posted On: December 20, 2017
The question that has been revolving around people’s minds is ‘How to formulate a Cross Browser Testing Strategy’? The answer usually revolves around what are the most popular browsers of your target audience. You start by covering the most popular browsers in your test coverage followed by the least used. This infographic on browser statistics is going to help you decide which browsers to target first for your cross platform test coverage.
References:
https://tech.co/comparison-top-10-cross-browser-testing-tools-infographic-2016-03
http://gs.statcounter.com/browser-version-market-share#monthly-201707-201707-map
https://www.usatoday.com/story/money/markets/2017/08/08/a-foolish-take-how-ios-and-android-killed-windows-phone/104160196/
https://www.theverge.com/2017/2/16/14634656/android-ios-market-share-blackberry-2016
https://www.w3schools.com/browsers/browsers_mobile.asp
https://www.statista.com/statistics/268299/most-popular-internet-browsers/
https://www.netmarketshare.com/browser-market-share.aspx
https://en.wikipedia.org/wiki/Usage_share_of_web_browsers
Author
Deeksha Agarwal
Deeksha Agarwal is in Product Growth at LambdaTest and is also a passionate tech blogger and product evangelist.
Blogs: 42